
Scott Hessels
INTRO
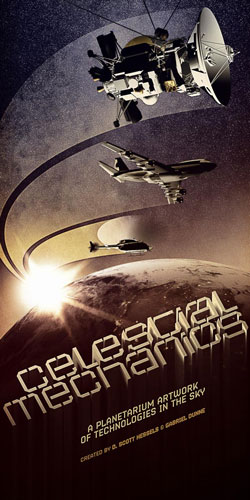
In 2003, I began a planetarium artwork called Celestial Mechanics with Gabe Dunne. Instead of stars and planets, the ‘night sky’ program interpreted the paths, behaviors and patterns of over 30,000 aerial technologies—planes, helicopters, satellites, etc.
Nearly a decade later, the project continues to exhibit globally and has provided a perspective on how we construct meaning about space and the airborne machines that are filling it.
PROCESS OVERVIEW
I made the piece at UCLA with a team of student animators and programmers. I worked with dozens of government, science and private agencies to collect the actual longitude, latitude and altitudes of nearly 50 airborne technologies, mostly in text form.
The data was loaded by programming scripts into a 3-D Modeling software and we plotted the movements into a virtual sphere.
a team of animators worked with our drawings to artistically interpret the paths and functions. This was heavy-lifting in 2004, it would be an app in 2012. Real-time and global scale visualizations are everywhere.
George Lucas volunteered Skywalker Sound to create the sound design for the project and it premiered in 2005 has since exhibited internationally, been featured in magazines like Wired and Discover. As you look at these animations, remember it’s a dome, imagine the round video as being over top of you.
ORIGINAL GOAL: SCALE AND AWE
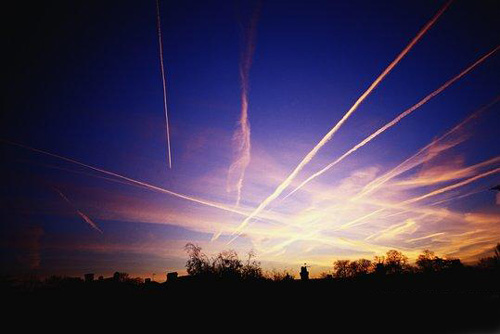
Scale is part of information. In 2003, Science agencies were collecting massive amounts of data—this is a weather service animation of jet contrails—but everything was reduced to 720x540 pixels.
We lost the awe that comes with scale. NASA created this video to alert the public of the increasing space debris, but our primitive display systems were stripping the meaning from this kind of data.
Planetariums gave me a way to visualize a complex system without losing that emotion. Instead of a rectangle on a computer screen, you look up at the sky and seeing the communications satellites coming into line-of-site with the geostationary ring that hovers above the equator. There is a sense of wonder when the data is mapped in an immersive display.
ORIGINAL GOAL: CULTURAL CODING OF PATTERNS
But this was not a scientific visualizaton project, I was more interested in the cultural coding that was evolving. The Los Angeles Police Department gave us the video, GPS, and altitude of an actual police chase thru LA and it demonstrates how many of the machine behaviors in the artwork are already part of our semiotic language. The shaky blue circle of light from a police helicopter is as packed with associations as military planes flying in perfect V formation, stacked planes over LAX, and the melancholy dissipation of distant jet trails. As the hardware relationships evolve above us, it is becoming an emerging cultural mythology.
ORIGINAL GOAL: DE-MYSTIFYING, REVEALING THE HARDWARE
But I was also interested in how we have forgotten that our daily lives are connected to hulking, massive machines. That online weather report this morning was created by over a thousand balloons being launched twice a day all over the planet, rising, transmitting, bursting.
Like the Internet, we now like to pretend our technologies are immaterial, distributed, democratic, amorphous. We don’t talk about hardware anymore, we talk of ‘clouds.’ However, by not being aware of the machines we use, we may also not be aware of the social, economic, cultural, and political importance of these technologies. I’d hoped that by visualizing them, it would lead to a better understanding of the forces that are shaping our future.
Space is becoming increasingly militarized, but also increasingly commercialized…as corporations become the new nations we’re seeing space tourism, space delivery and repair, increasing communications networks. In 2003 I could not get any military data except for conflicting statistics on the decaying Russian spy network. Today, I doubt I’d get corporate data either.
OBSERVATION: A CULTURAL VISUALIZATION SHIFT
Ten years ago technologies were presented in a specific language meant to highlight their science as this 2002 air traffic video made by NASA demonstrates.
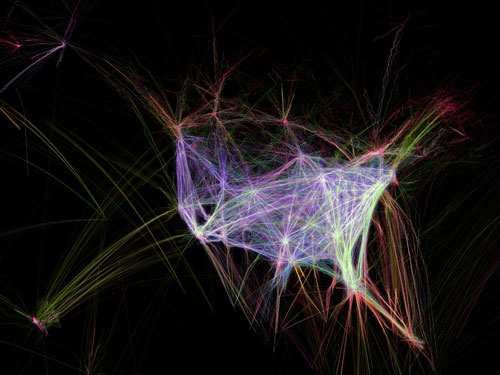
For Celestial Mechanics, The Federal Aviation Administration gave me the longitude, latitude, and altitude for every commercial plane, over 20,000, every three minutes, over 12 hours.
One of the students I hired at UCLA was Aaron Koblin and he was given the FAA data, the concept and sketches. He used processing to visualize the data and released his experiments as “Flight Patterns” which became a global viral sensation, winning awards, and even showing at the Museum of Modern Art where you can buy the poster. It became a meme, the meme became the cultural interpretation.
The video continues the view from Outer Space that NASA pioneered in the early 1960’s. Visualizations of manmade and natural phenomena above us are viewed from above them looking down, the opposite of how we actually experience them. It’s backwards from our phenomenology.
So it’s still the science POV, but the physical reference is gone in this section—we don’t need the RADAR outline of the US, the air traffic makes the geography clear. This is the data view, not from an imaginary camera in space, but from the crunching of numbers.
OBSERVATION: DATA VIZ IS THE NEW SCIENCE FICTION
NASA gave me the actual GPS satellite paths and I showed the Russian and US systems flying in tandem, speaking to each other in triangles. Our understanding of the machine is no longer the object, the metal box of wires, but its path…we understand these threads as technologies. Path has replaced physical presence.
OBSERVATION: A HUMAN/MACHINE HYBRID OF EMERGENCE
The statistics for “Celestial Mechanics came in from separate sources, in exclusive datasets that eerily ignored the other competing systems that were in the sky. NASA tracks some, hides some, ignores some, but no one controls.
Airplanes capture weather data as they fly but the density of their jet trails are changing the weather at the same time. Technologies are adjusting in relation to other technologies and the hardware and software in the sky are demonstrating behaviors that were never coded into their original design. Partially human-controlled, above us is becoming a human/emergent hybrid, a gradient system that is evolving both by human interaction and its own self-modification.
OBSERVATION: THE DESIGNIFICATION OF ART
The artwork also made me consider the field of information arts and worry about their emphasis on design. These are a few of the low-earth orbiting surveillance satellites, mostly weather and science. A recent New York magazine profile had the byline “if this messy world is becoming easier to understand, thank Edward Tufte.” The implication is not so implied—we believe clarity is the same as understanding.
We’ve come to think that converting our messy, cluttered world into numbers and then using those numbers for visualization by either art or science is a necessary step towards understanding.
But in this video, I calculated how much each satellite is seeing of the ground below—its footprint.
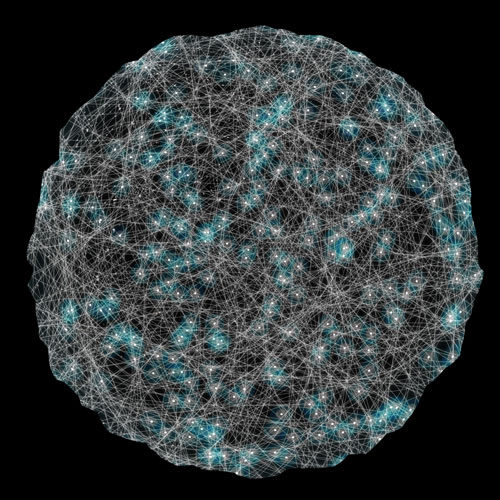
This mess, where we can’t even discern which ring goes with which satellite, is the truest moment in the piece because it’s the least clear. Chaos and disarray are better felt than interpreted.
”Celestial Mechanics” now serves as a historical snapshot as private companies, emerging nations and even individuals are layering hardware above us like a mechanical Powers-of-Ten. It’s huge and we have to understand it.
But understanding is phenomenological, personal, instinctual as well as logical. Perhaps with space, we should stop obsessing on the visualization of chaos and look towards chaotic visualization.
CLOSE: www.dshessels.com